Documentation
Analytics & Reports
Dashboard metrics, trends, alerts, AI-assisted context on the dashboard, pinning insights from chat, and tier-based reporting
On this page▼
Effitrio surfaces analytics primarily on the Dashboard so you see cash flow and operational signals in one place.
Dashboard overview
The main /dashboard view combines:
- Financial snapshot — revenue and expenses for the current month, comparison to last month, and net income.
- Trends — recent months of revenue and expense history used for sparkline-style trends and month-over-month change where a baseline exists.
- Invoice health — counts such as overdue invoices, unpaid totals, and drafts waiting to go out.
- Business footprint — active projects and active clients.
- Recent invoices — quick access to what was issued lately.
The dashboard also keeps AI in context with your numbers: the assistant can reason about your workspace while you stay on the same screen—useful for quick questions without jumping away from KPIs.
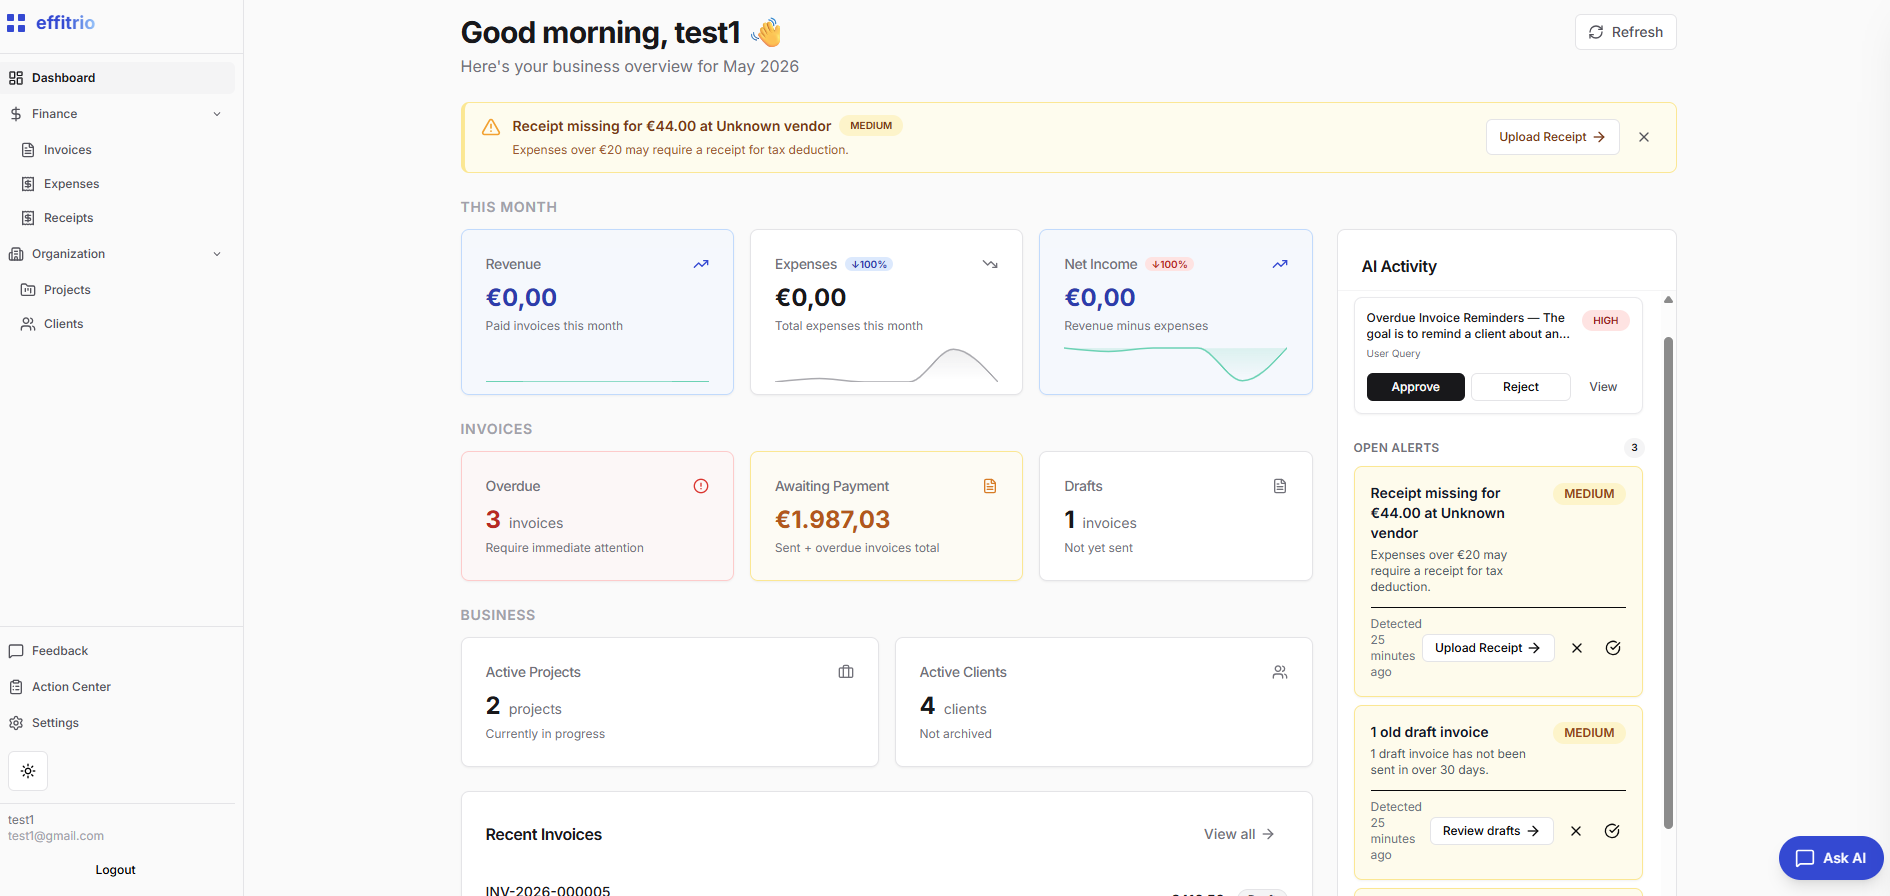
Stats refresh on a regular interval while you keep the dashboard open, and you can refresh manually.
Revenue and expense insights
Use the dashboard cards and charts to answer:
- Are we billing more or less than last month?
- Are expenses growing faster than revenue?
- What does net income look like after expenses this month?
Historical series are scoped to the summary the API returns (typically recent months); use Finance for deep lists and line-item work.
Proactive alerts
The dashboard includes deterministic alerts (no AI charge) such as:
- Overdue invoices
- Aging drafts
- Quiet periods with little activity
- Expense spikes
Each alert suggests an action and links you to the relevant area of the app.
AI insights and pinned charts
Pinned insights come from AI/chat results you choose to pin to the Dashboard. Availability and presentation can depend on your plan (for example teaser vs live charts on lower tiers). Older /dashboard/ai-insights URLs redirect to the main Dashboard — insights live there now.
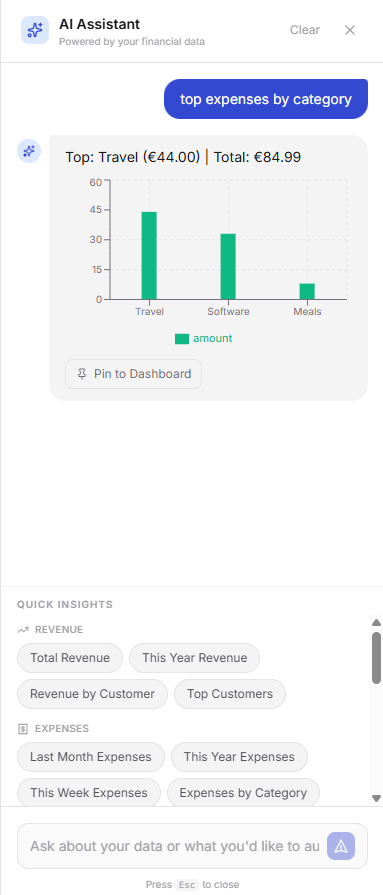
Pin a chart or insight to the Dashboard
When the assistant returns a chart, table, or summary you want to keep in view, use the pin flow from that result. Pinned items show on /dashboard next to your standard cards so you can watch them without reopening chat.
Step 1 — start pinning from the AI result
Step 2 — see it on the Dashboard
After you confirm, the pinned insight appears in the dashboard layout with the rest of your metrics (exact placement may vary by screen size).
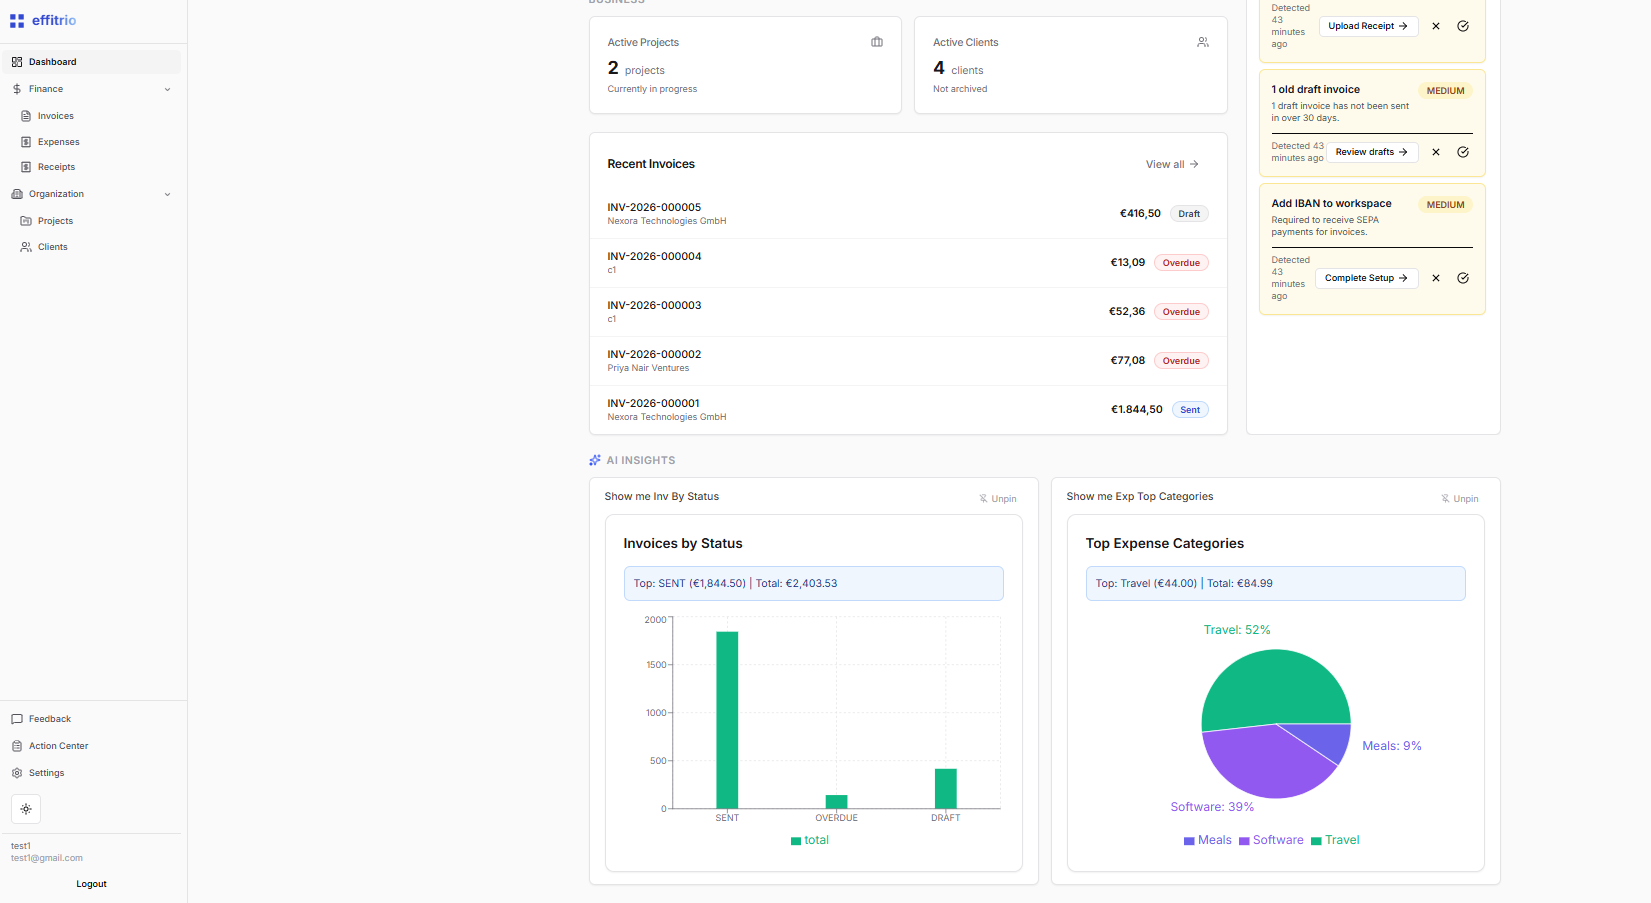
You can manage or remove pinned items from the dashboard when you no longer need that view.
Advanced reports and exports
Tier-based features may include advanced reporting, profitability views, tax-oriented reports, or full data export. On tiers where export is enabled, workspace owners can download an export from Settings → Account & Privacy.
If a capability is not present in your workspace, upgrade options appear in Settings → Subscription.
Related
- Getting Started — navigating the app
- Invoices and Expenses — source data behind the metrics
- AI Workflows — goals, approvals, and assistant-driven flows